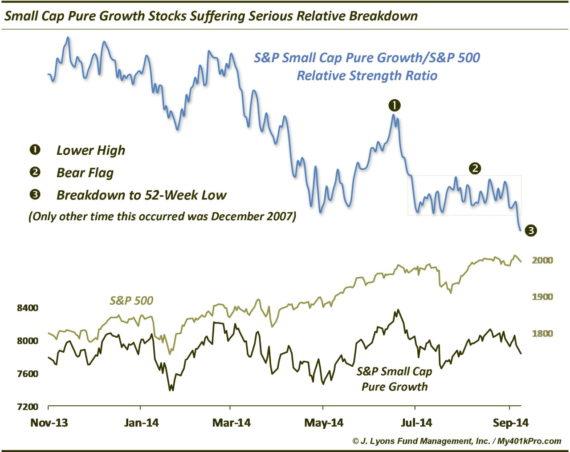
The Ugliest Chart In Equity Land: Small Cap Growth One great thing about markets is that at any given time you’ll find no shortage of…


The Ugliest Chart In Equity Land: Small Cap Growth One great thing about markets is that at any given time you’ll find no shortage of…

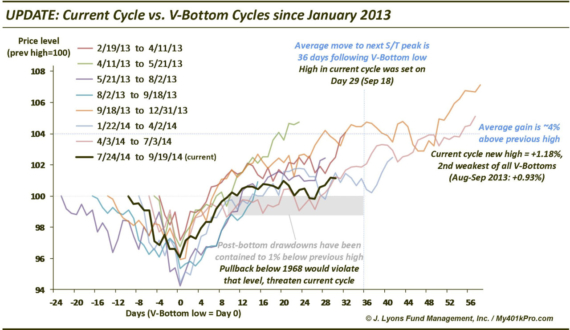
V-Bottom Update: Current Cycle Still Following The Template On August 19, we noted that given the recent action in the stock market, “V-Bottoms” were still…

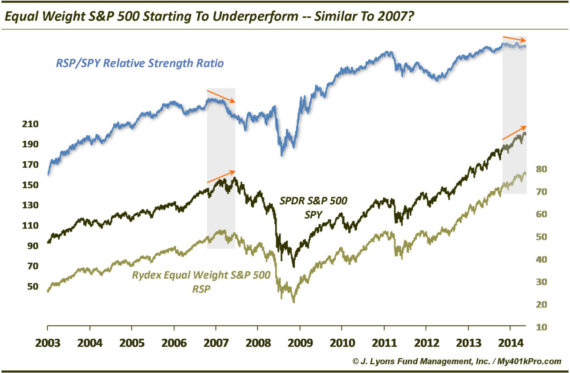
Equal Weight S&P 500 Starting To Lag – Shades of 2007? Another divergence post? Yes, sorry, we know it is getting mundane. However, we post…

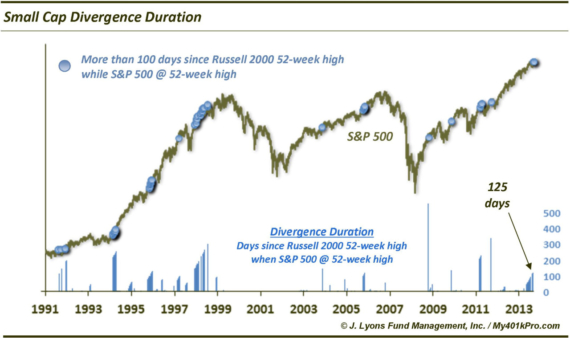
Is the duration of the small cap divergence a concern? We have commented on many occasions about the importance of broad participation of stocks and…
Today’s ChOTD looks at the International Securities Exchange (ISE) Equity Call/Put Ratio. For those unfamiliar, ISE presents options ratios a bit differently than most exchanges.…
Plenty of folks in the financial blogosphere and media have discussed the S&P 500’s current streak above its 200-day moving average. We thought we’d add…
Touching on the pervasive “low-volatility” theme, today’s ChOTD looks at the Average True Range of the S&P 500 since 2007. Average True Range is a…
This week we presented a series of charts outlining how recent index highs pass the so-called market top “look test”. By that we mean that…
Continuing our series on why recent index highs pass the so-called market top “look test”, today we look at the S&P 500 (previously we looked…
On Friday, May 23, the S&P 500 closed at a 52-week high while the 5-day average volume on the NYSE closed at a 52-week low…