The Oil Volatility Index convincingly broke below its post-2014 Up trendline today; that could mean less volatility ahead for oil prices. Volatility indexes have become…
Tagged $XLE
The Line In The (Oil) Sand
The current test of a 30-year trendline could determine whether or not the bounce in oil stocks is sustainable. What do all the inquiring minds…
Will 30-Year Trendline Put Cap On Oil Stock Drop, Or Lead To Another Gusher?
The post-1985 UP trendline could provide support for the XOI Index – but a break could accelerate losses. With oil and oil stocks at the…
Energy Stocks Flowing Up Wall Of Worry?
Despite sharp bounce, energy funds have not yet attracted heavy inflows. Much of the market debate currently is centered around the question of whether the…
Impressive Bounce For Stocks Following Re-test — But Will It Last?
The stock market has shot up following last week’s retest of the August lows – but is it sustainable or just temporary? As investors digest…
Oil Stocks Testing Breakdown Level Of Long-Term Uptrend
One of the biggest casualties of the recent stock market decline has been energy stocks. One may even argue that they are the culprit, or…
A Glimmer of Hope for Oil Bulls
On March 13, we posted a piece on the divergence between the Euro and the Euro Volatility Index (EVZ). The EVZ (like most volatility indexes)…
World’s 2nd Largest Stock Testing Historic Trendline
We don’t often discuss individual stocks, either in our practice or in these pages. So when we dedicate our Chart Of The Day to a…

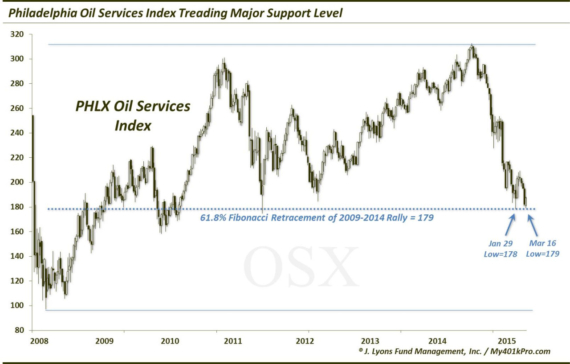
Oil Services Sector Treading Major Support Level After being bludgeoned in the back half of 2014 (to the tune of -35%) along with all oil-related…

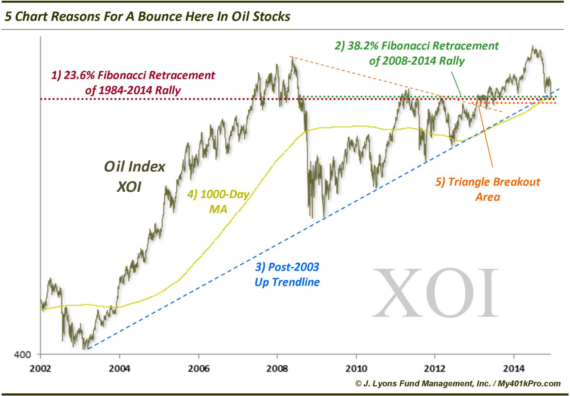
5 Chart Reasons For A Bounce In Oil Stocks Earlier today, we put up a post revealing that total assets in Rydex energy sector funds…