The current test of a 30-year trendline could determine whether or not the bounce in oil stocks is sustainable. What do all the inquiring minds…
Tagged $XOM
Will 30-Year Trendline Put Cap On Oil Stock Drop, Or Lead To Another Gusher?
The post-1985 UP trendline could provide support for the XOI Index – but a break could accelerate losses. With oil and oil stocks at the…
Major Market Index Fails Key Test
The blue chip Major Market Index failed to recapture a key breakdown level. This post is about 2 weeks late, but still very pertinent in…
Oil Stocks Testing Breakdown Level Of Long-Term Uptrend
One of the biggest casualties of the recent stock market decline has been energy stocks. One may even argue that they are the culprit, or…
Oil Services Sector Again Testing Key Support (& Fate?)
Back on March 19, we noted that the key Oil Services Index (OSX) was testing an important line of support. Specifically, it was the 61.8%…

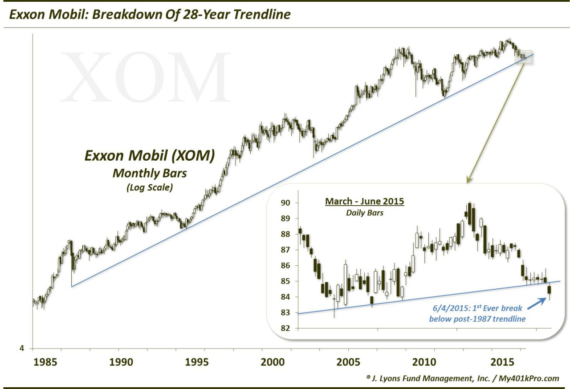
Update: World’s 2nd Biggest Stock Breaking 28-Year Trendline On March 24, we posted a rare piece on an individual stock. As we do not invest…
A Glimmer of Hope for Oil Bulls
On March 13, we posted a piece on the divergence between the Euro and the Euro Volatility Index (EVZ). The EVZ (like most volatility indexes)…
World’s 2nd Largest Stock Testing Historic Trendline
We don’t often discuss individual stocks, either in our practice or in these pages. So when we dedicate our Chart Of The Day to a…
Gas Prices Far Outpacing Crude: Blowoff Top or Long-Term Bottom?
If you’re like us, maybe you wonder why gas prices always seem to go up a lot faster than they come down. That’s our anecdotal…
Historic Flame Out In Energy Stocks
Energy stocks have had an extremely rough go of it lately. In the past few months, they have been on the receiving end of a…