One method of analyzing stock market sentiment is by measuring activity in the options market. The benefit of this type of analysis is that, contrary…
Tagged $DIA
Yesterday Was One of the Ugliest “Up” Days in History
At yesterday’s close the major averages, S&P 500, Dow Jones Industrial Average and Nasdaq Composite, were all in the green. However, despite the fact that…

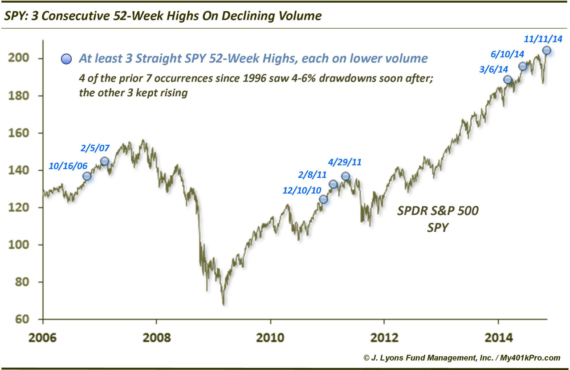
String of Low Volume New Highs A Short-Term Concern A couple weeks ago, we commented that the waning volume accompanying the rally off the October…
The V-Bottom is STILL in fashion
The V is baa-aack. No, not the dreadful yet alluring mid-80’s sci-fi, quasi-cult classic mini series wherein aliens arrive on Earth in a mother ship…
Largest Monthly Reversals In Stock Market History
Piggybacking on yesterday’s post about October’s clutch tendency to launch rallies, today’s Chart Of The Day looks at this month’s big bounce off its near 7%…
(Mr.) October living up to clutch month reputation
In the equity investment world, the month of October has typically received a bad rap. Much of it deserved, given the number of ignominious events…
High-volume breakdowns lead to nearby bottoms — after a flush
Yesterday, the S&P 500 accomplished a rare feat. It touched a 6-month low (before recovering) on the heaviest volume day in a year on the…
Is the volatility spike over — or just beginning?
Unless you have been in a bunker hiding from ebola, you’ve no doubt noticed the pick up in volatility across basically all asset classes. In…
Amid heavy selling, a light at the end of the tunnel
On September 26, we wrote a post titled “90% Down Volume Days Have Been Good Buy Signals…With One Catch” looking at the phenomenon of 90%…
Stocks Entering Best Stretch of Presidential Cycle…By Far
Most investors are likely familiar with the Presidential Cycle as it pertains to the stock market. It refers to the tendency of the stock market…