Piggybacking on yesterday’s post about October’s clutch tendency to launch rallies, today’s Chart Of The Day looks at this month’s big bounce off its near 7%…
Tagged $SPY
(Mr.) October living up to clutch month reputation
In the equity investment world, the month of October has typically received a bad rap. Much of it deserved, given the number of ignominious events…
Sharp rallies on low volume a short (and long?) term concern
We’ve mentioned on numerous occasions that we do not include volume as a significant input into our market analysis. So why 2 posts in three…
Rapid retreat in volatility bullish for stocks
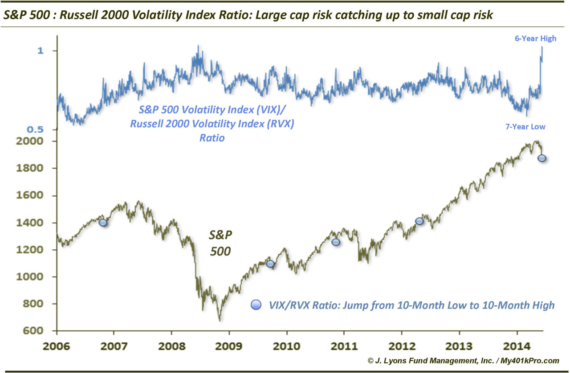
Just yesterday, we posted a chart showing that the S&P 500 Volatility Index (VIX) had recently spiked to a 6-year high relative to the Russell…

Historic shift in volatility from small to large caps There has been an abundance of discussion recently regarding the relative performance of large caps to…

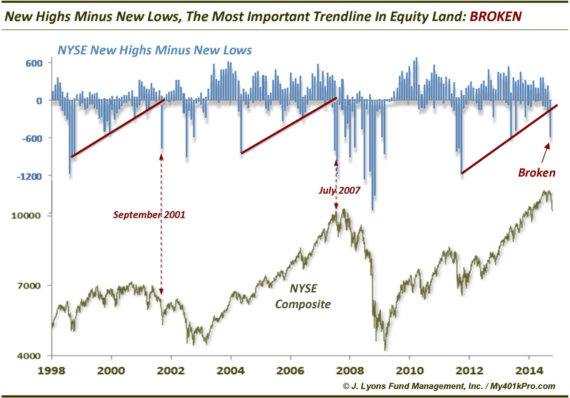
UPDATE: The Most Significant Trendline In Equity Land = BROKEN On September 25, we presented what we termed, The Most Important Trendline In Equity Land, namely…
High-volume breakdowns lead to nearby bottoms — after a flush
Yesterday, the S&P 500 accomplished a rare feat. It touched a 6-month low (before recovering) on the heaviest volume day in a year on the…
S&P 500 streak above its 200-day moving average is over – what now?
All good things must come to an end. That includes the S&P 500’s streak of closing above its 200-day simple moving average which ended yesterday…
Is the volatility spike over — or just beginning?
Unless you have been in a bunker hiding from ebola, you’ve no doubt noticed the pick up in volatility across basically all asset classes. In…
Amid heavy selling, a light at the end of the tunnel
On September 26, we wrote a post titled “90% Down Volume Days Have Been Good Buy Signals…With One Catch” looking at the phenomenon of 90%…